Welcome to Evolink
Overview
Evolink is a phylogeny-based tool to detect genotypes (both positively and negatively associated ones) associated with a phenotype present in multi-species datasets (e.g. resistance, virulence, host and colony).
Identification of genotype-phenotype associations is a fundamental task not only in microbiology but also across all of biology. Yet as the amount of microbial data is rapidly increasing, the amount of identified gene families (~10^6) and size of phylogenetic trees (with > 10^5 leaves) make it difficult to apply current methods to link genotypes to phenotypes.
Utilizing phylogenetic information is a good way to control for population structure in microbial genotype-phenotype association analyses helping to avoid spurious findings. That’s why Evolink was developed based on the use of phylogeny.
Evolink is able to outperform other similar tools in terms of accuracy and efficiency, being able to handle large datasets in just minutes.
Installation
To install Evolink is easy and you have two choices.
Use Mamba
To expereince a much faster installation:
Please install mamba first.
If you use Linux, installing mamba is very easy:
wget https://github.com/conda-forge/miniforge/releases/latest/download/Mambaforge-$(uname)-$(uname -m).sh
bash Mambaforge-$(uname)-$(uname -m).sh
The installation is very similar to using conda.
-
Step 1. Git clone project
git clone https://github.com/nlm-irp-jianglab/Evolink.git
cd Evolink -
Step 2. Build mamba environment
mamba env create -f environment.yml -
Step 3. Activate Evolink environment
conda activate Evolink -
Step 4. Setup required R packages
Rscript setup.R
Use Conda
- Install Anaconda or Miniconda first. They are distributions of the Python and R programming languages for scientific computing, greatly simplifying package management and deployment.
-
Step 1. Git clone project
git clone https://github.com/nlm-irp-jianglab/Evolink.git
cd Evolink -
Step 2. Build conda environment
conda env create -f environment.yml -
Step 3. Activate Evolink environment
conda activate Evolink - Step 4. Setup required R packages
Rscript setup.R
Alternatives
In addition to a local installation of Evolink, we provide both a docker image and webserver that can be used to run Evolink analyses.
Docker: https://hub.docker.com/r/nlmirpjianglab/evolink Webserver: https://jianglabnlm.com/evolink/
Input
Evolink takes 3 essential input files: 1) A species tree (in newick format). It is recommended that the tree is rooted. Internal node names are not necessary. For example:
(species_1:1,(species_2:1,(species_3:1,species_4:1)Internal_1:0.5)Internal_2:0.5)Root:0.1;
2) A trait/phenotype binary file (tab separated file). The column headers should be “Tip” and “Status”. The tip column contains the tip names the same as the tree, while the Status column contains the presence (1) and absence (0) of the phenotype for each leaf. So far only 1 or 0 is accepted and all leaves should be labeled with a 0/1 status. For example:
| Tip | Status |
|---|---|
| species_1 | 0 |
| species_2 | 1 |
| species_3 | 1 |
| species_4 | 0 |
3) The gene presence/absence matrix file (tab separated file). Each row is the binary (0/1) status of each gene across all species. Each gene should appear in a species for at least one time. The first colname could be any word, but “orthoID” (orthogroup ID) is a nice choice to be shown here. For example:
| orthoID | species_1 | species_2 | species_3 | species_4 |
|---|---|---|---|---|
| gene_1 | 0 | 1 | 1 | 0 |
| gene_2 | 1 | 1 | 0 | 0 |
| gene_3 | 1 | 0 | 1 | 0 |
| gene_4 | 0 | 1 | 0 | 1 |
Usage
usage: Evolink.py [-h] -g GENE_TABLE -t TRAIT_TABLE -n TREE [-m MODE] [-c]
                  [-p THRESHOLD] [-s SEED]
                  [--min-outlier-score-threshold THRESHOLD]
                  [--n-estimators NUMBER] [--max-samples PERCENTAGE]
                  [--gesd-mc-method METHOD] [--gesd-pval-threshold THRESHOLD]
                  [--gesd-padj-threshold THRESHOLD] [-z THRESHOLD]
                  [-e THRESHOLD] [--fold-times FOLD_TIMES]
                  [--perm-mc-method METHOD] [--perm-padj-threshold THRESHOLD]
                  [-v] [-N TOP_GENES] [-d {1,2}] [-f] -o OUTPUT

Evolink is designed to find gene families associated with a trait by explicitly
using phylogeny information.

optional arguments:
  -h, --help            show this help message and exit
  -g GENE_TABLE, --genotype GENE_TABLE
                        Tab-delimited gene presence/absence or copy number
                        table. Columns are gene families, while rows are tip
                        names/species/genomes in the phylogenetic tree. If
                        copy number table is provided, please use -c option so
                        that it will be internally converted to binary table.
                        Presence=1, Absence=0.
  -t TRAIT_TABLE, --phenotype TRAIT_TABLE
                        Two-column (so far only one trait is allowed each
                        time) tab-delimited trait presence/absence table. The
                        first column is tip names and the second column is the
                        presence/absence of this trait on the
                        tips/species/genomes. Presence=1, Absence=0.
  -n TREE, --phylogeny TREE
                        A phylogentic tree in newick format. The tip names
                        should be the same in the gene table and trait table.
  -m MODE, --mode MODE  Evolink has four modes insofar to detect phenotype-
                        assoicated genotypes: isolation_forest, gesd_test,
                        (modified) z_score, and cutoff. Running time:
                        isolation_forest > gesd_test > z_score > cutoff.
                        [Choices: isolation_forest, gesd_test, z_score,
                        cutoff; Default: isolation_forest]
  -c, --copy-number     The given gene table stores numbers (e.g. gene copy
                        numbers) instead of presence/absence binary values.
                        [Default: True]
  -p THRESHOLD, --p-threshold THRESHOLD
                        Absolute Prevalence index threshold to filter genes
                        and get Evolink index distribution [Range: 0-1;
                        Default: 0.9]
  -s SEED, --seed SEED  Set seed for simulation for reproducibility of the
                        results [Default: 1]
  --min-outlier-score-threshold THRESHOLD
                        A minimal threshold to determine outliers by
                        IsolationForest [Default: 0.7; Range: 0.5-1]
  --n-estimators NUMBER
                        Number of tree estimators used in IsolationForest
                        [Default: 200]
  --max-samples PERCENTAGE
                        Percentage of training samples for each tree in
                        IsolationForest [Default: 0.1]
  --gesd-mc-method METHOD
                        Multitest correction method [Choices: none,
                        bonferroni, fdr, holm, hommel; Default: none]
  --gesd-pval-threshold THRESHOLD
                        Original p-value threshold [Default:0.1]
  --gesd-padj-threshold THRESHOLD
                        Adjusted p-value threshold [Default:0.2]
  -z THRESHOLD, --z-score-threshold THRESHOLD
                        Absolute modified z-score threshold [Default:3.5]
  -e THRESHOLD, --e-threshold THRESHOLD
                        Absolute Evolink index threshold to select significant
                        genes. [Range: 0-1; Default: 0.375]
  --fold-times FOLD_TIMES
                        Simulate N*the bumber of genotype input provided by
                        users after filtering (namely simulate N*nrow(gene
                        matrix after filtering) times) [Default: 10]
  --perm-mc-method METHOD
                        Multitest correction method [Choices: bonferroni,
                        fdr_bh, holm, hommel; Default: fdr_bh]
  --perm-padj-threshold THRESHOLD
                        Adjusted p-value threshold [Default:0.001]
  -v, --visualization   Whether to generate plots
  -N TOP_GENES, --top-genes TOP_GENES
                        Top positively and negatively associated genes mapped
                        to tree. [Default: 5,5 for top 5 pos genes and top 5
                        neg genes.]
  -d {1,2}, --display-mode {1,2}
                        Tree display mode. [1: circular, 2: rectangular;
                        Default: 1]
  -f, --force           Force to overwrite output folder. [Default: False]
  -o OUTPUT, --output OUTPUT
                        output directory
Examples
- Unzip test data first
unzip test_data/test_data.zip - With a binary gene presence/absence table and no plots by default (the most common usage):
python Evolink.py -g test_data/gene.tsv -t test_data/trait.tsv -n test_data/tree.nwk -o output_dir - With a gene copy number table (add “-c” option):
python Evolink.py -g test_data/gene_CN.tsv -c -t test_data/trait.tsv -n test_data/tree.nwk -o output_dir_CN - Enable the plot function (add “-v” option. To save time, Evolink will not generate figures by default):
python Evolink.py -g test_data/gene.tsv -t test_data/trait.tsv -n test_data/tree.nwk -o output_plot_dir -v - “-N” is to map top nine positively and top eight negatively associated genotypes in the plot; “-d” is to use circular layout for the tree; “-f” is to force overwrite the output directory if it already exists:
python Evolink.py -g test/gene.tsv -c -t test/trait.tsv -n test/tree.nwk -o output_dir -f -v -N 9,8 -d 1
Output
The basic output file from Evolink is named “result.tsv” and is generated in the output directory provided by the user. It includes “Evolink_index”, “Prevelance_index”, “significance” and “z_score”. The “Evolink_index” and “significance” are the most useful values for identifying positively and negatively associated genes. For example:
| orthoID | Prevalence_index | Evolink_index | pvalue | pvalue.adj | significance |
|---|---|---|---|---|---|
| g5777 | -0.4625054136846366 | 0.10671872772220814 | 1.0 | 1.0 | NA |
| g5778 | -0.042440298419339606 | 0.5233140665345326 | 0.0030094935692830003 | 0.0030094935692830003 | sig |
| g6658 | -0.9507252999311486 | -0.011385526945414837 | NA | NA | NA |
| g6659 | -0.07100522867170539 | 0.5214738941543501 | 0.003255689458338912 | 0.003255689458338912 | sig |
| g6660 | -0.9527124863232308 | -0.009398340553332718 | NA | NA | NA |
| g8004 | 0.19435017310947744 | 0.619534971390268 | 3.0051525400727557e-05 | 3.0051525400727557e-05 | sig |
When enabling the plot function (with -v or –visualization option), Evolink generates four types of figures in the output directory (see example outputs here and here):
1) iTOL website input
A tree file (input.tree) and annotation file (binary.txt) as well as a zipped file called Evolink_itol_input.zip are provided for users to visualize their results on the Tree of Life (iTOL).
a) You can simply upload the input.tree to iTOL website and drag binary.txt onto the webpage for visualization.
b) Or if you have a iTOL subscription API key and have installed iTOL API, you can use the following command line to upload and annotate your tree.
itol Evolink_itol_input.zip -i <your iTOL upload API key> -p <project_name>
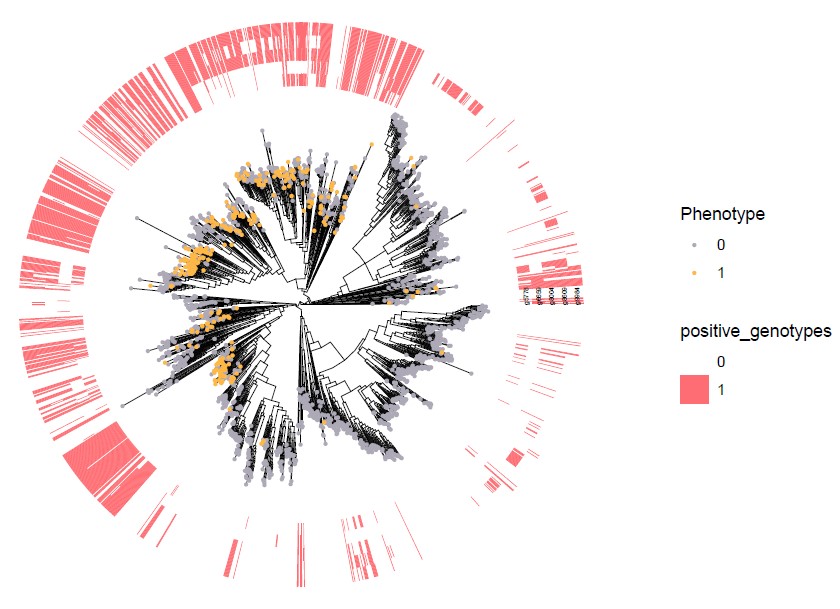
2) ggtree plot for positively and negatively associated genotypes
Positive_genotypes_ggtree_plot.pdf
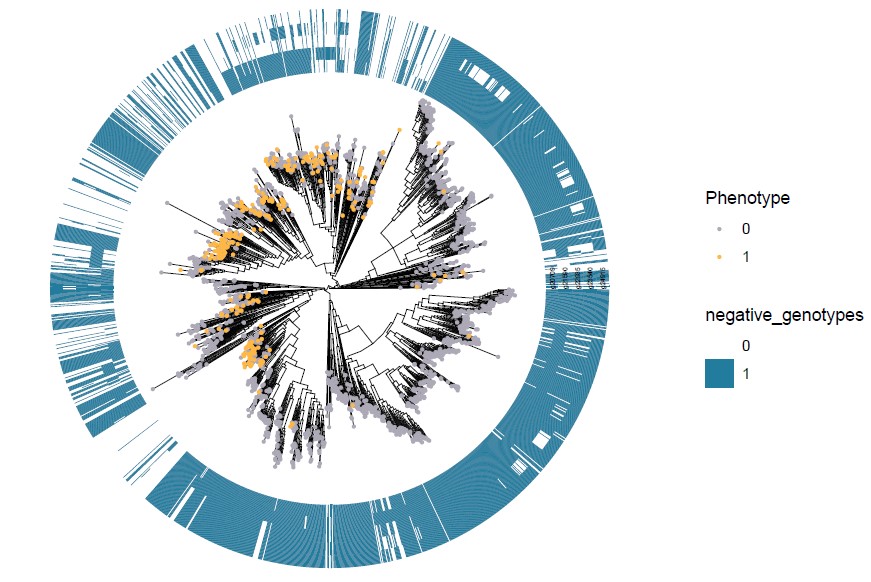
 Negative_genotypes_ggtree_plot.pdf
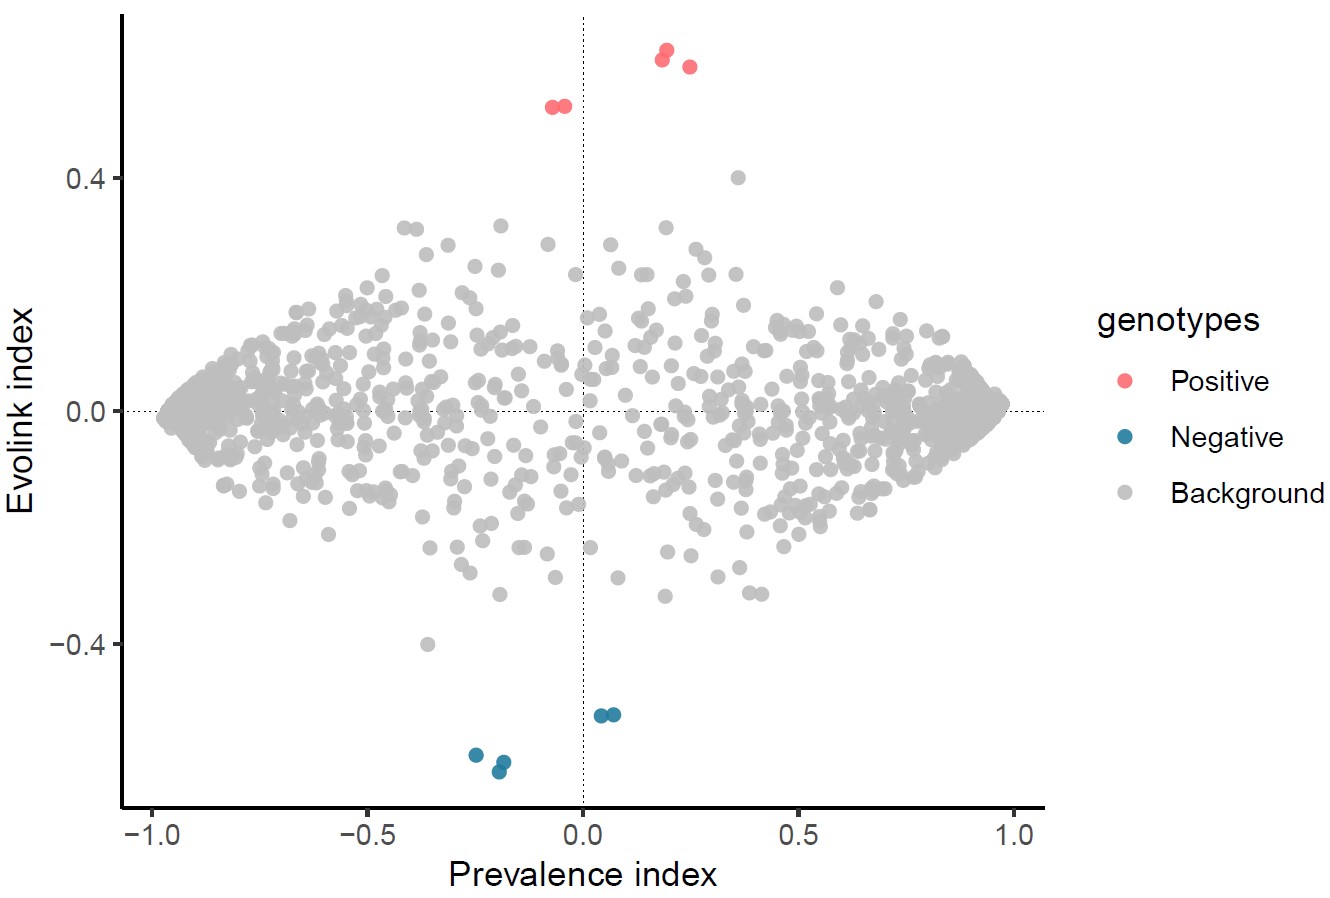
3) Evolink plot
Evolink_plot.pdf
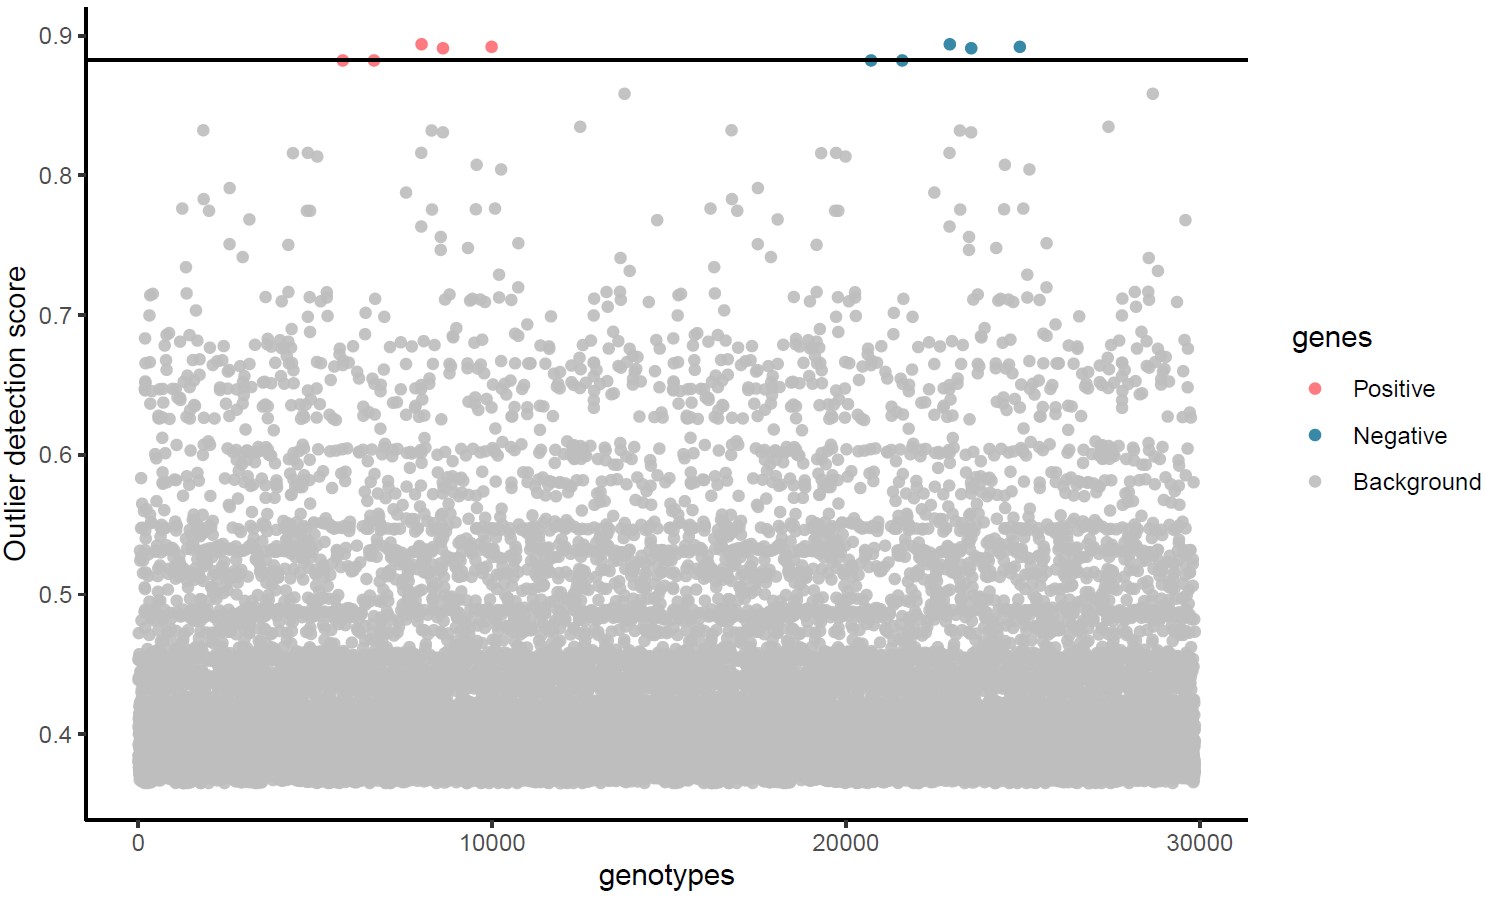
4) Manhattan plot
Manhattan_plot.pdf
In addition, we also provided a script “Evolink_plot.R” to individually generate local figures after you get the result from Evolink (i.e. result.tsv):
Rscript --vanilla Evolink_plot.R -g test_data/gene.tsv -t test_data/trait.tsv -n test_data/tree.nwk -r test_data/output_dir/result.tsv -o test_data/plot_dir
Use case
We further provide a use case with Flagella data as an example. Click here for more details.
FAQ
- Q1: What if my data contains species with multiple samples of genotype data (strains)?
-
1) If a species contains multiple strains with similar genotypes and same phenotype, the easiest solution would be to select a representative strain to serve as a genotype representative for that species. 2) If the strains of a species display diverse phenotypes, we would recommend constructing a phylogenetic tree that includes all strains and utilize all available genotype and phenotype information in the analysis. It should be noted that mGWAS (microbial genome-wide association study) methods (such as Bugwas, Pyseer and treeWAS) are recmmended for multiple samples from closely related species, as they not only consider gene presence and absence but also single nucleotide polymorphisms (SNPs).
- Q2: What if a genome is assigned with multiple phenotypes?
- If a genome is associated with multiple categories of phenotype, it is recommended to treat each category as a separate binary variable using one-hot encoding and to run Evolink separately for each category.